https://ucanrventura.westernweathergroup.com/
The two most important decisions for improving irrigation efficiency and its effect on yield and plant health are when to start the irrigation, and how long to irrigate. While soil moisture sensors are effective at telling when to irrigate, evapotranspiration (ET)-based scheduling is our best tool to determine how long (or how much) to irrigate. With many irrigations in a crop cycle, ranch managers’ and irrigators’ decisions of how long to irrigate are rarely data driven and are most commonly done based on field observations and/or on a calendar-basis. While weather station data can provide relevant information to guide irrigation decisions, it is essential that its data are representative of the area of interest.

Ventura County has distinct microclimates influenced by its diverse geography and proximity to the ocean. The county has a Mediterranean climate, but variations in elevation, distance to the coast and drier areas, in addition to unique topographic features create a range of microclimates that can lead to significantly different irrigation requirements. The complexity described above also leads to frequently unreliable weather forecasts.
Inexpensive stations are commonly deployed across the county and can effectively access current weather conditions (e.g.: temperature, relative humidity and precipitation), but they don’t provide quantitative guidance for irrigation management such as reference evapotranspiration (ETo) data. The reliable assessment of ETo requires additional sensors, no obstructions to wind such as buildings and trees, and a well-watered and well-maintained grass area around the station. The ETo data can then be applied to different crops and crop stages using correction factors commonly known as crop coefficients (Kc).
Users of ET-based irrigation have relied on the California Irrigation Management Information System (CIMIS, https://cimis.water.ca.gov) for over four decades. CIMIS was established as a collaborative effort between the Department of Water Resources (DWR) and UC Davis to assist irrigators in managing water resources more efficiently by providing daily ETo data through over 150 stations. However, DWR has recently started requiring 8 acres of well-irrigated grass to site a station. While no information has been provided or is currently available to justify the gains in accuracy with the increased size of the grass area, most of the CIMIS sites have considerably less grass footprint than 8 acres. Furthermore, poor maintenance has been a recurring issue with these stations, often leading to inaccurate data. For example, CIMIS station #152 in Camarillo recorded 10.1 inches of precipitation in the 2023/2024 season, while the actual precipitation around that area is closer to 24 inches. In addition, daily precipitation records from the irrigation sprinklers falling inside the rain gauge is another recurring issue at that station.
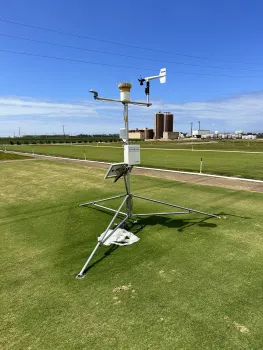
With several different microclimates in Ventura County, increased numbers of stations are essential to ensure accurate irrigation guidance. Unfortunately, our county only has two CIMIS stations (east Camarillo and Moorpark), which don’t truly represent coastal areas, Ojai, east Ventura, Santa Paula and Fillmore. With that in mind, the UC Cooperative Extension in Ventura County has decided to address these deficiencies by creating a new network of ET-weather stations. The first two stations were recently installed at our research station by Beardsley Rd and Central in Camarillo, and at Southland Sod by south Rice and Hueneme Rd in Oxnard. Their data can be accessed through this website: https://ucanrventura.westernweathergroup.com/
To exemplify how different irrigation requirements can be within adjacent microclimates, we analyzed the data from these two stations located only about 6 miles apart (Figure 1).
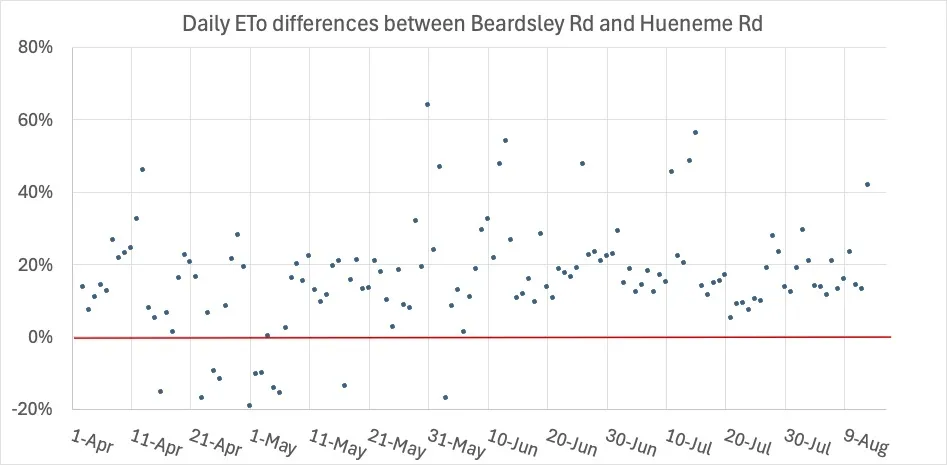
Figure 1 illustrates differences (%) in daily ETo between the Beardsley Rd station compared to the Hueneme Rd station from early April to late August 2025. The red line illustrates where all the blue points would be if there were no differences in crop water requirement between the two sites.
While the ETo for that period is on average only 16% greater at Beardsley, it was also equal or greater than 20% in 38% of the those days. Most important, the data shows unpredictable fluctuations in ETo varying from -20% to +64% between the locations. Such differences are expected to be even greater in warmer months and when compared to other microclimates.
In addition to providing farm managers and growers with representative measures of crop water demand, these stations’ data now feed into decision support tools that guide irrigation management, such as the Irrigation Calculator developed for strawberry, celery, cabbage, broccoli and cauliflower (https://ucanr-igis.shinyapps.io/irrigation-calc/), and the Irrigation Calculator developed for avocado (https://ucanr-igis.shinyapps.io/irrigation-calc-avo/).
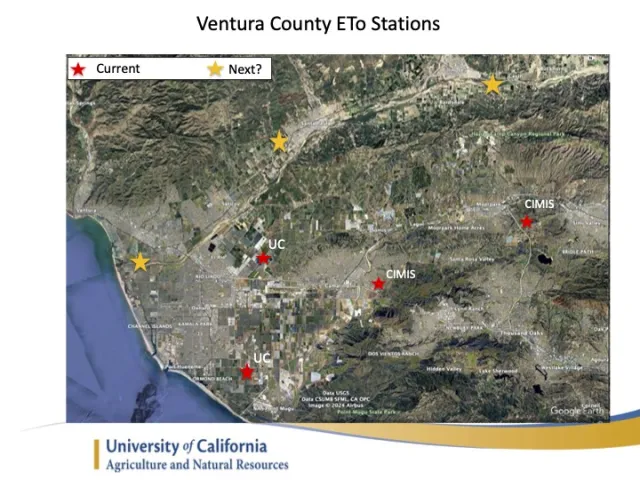
Our plan is to continue expanding this station network throughout the county by acquiring additional grant funds and finding collaborators willing to site more stations; finding suitable sites is certainly the main obstacle for this project. Please contact us if you have a spot in mind to host one of these stations (equipment and maintenance provided by UC), and we will follow up with additional information. In addition to getting accurate data for your fields, you will be helping Ventura County agriculture improve water optimization. If everything goes as planned, and with the support of our growers and community, Ventura County agriculture will be better served with several additional stations in the next couple of years.
Andre Biscaro, Ben Faber. UC Cooperative Extension, Ventura County.